The Semantic Layer for BI in 2026: Why It Matters (and How to Build It Without Creating More Chaos)
The Semantic Layer for BI in 2026: Why It Matters (and How to Build It Without Creating More Chaos)

If your BI feels like this:
- Finance says revenue is X, Sales says it is Y
- Two dashboards show different churn
- Every new report becomes a debate about definitions
- “AI analytics” gives confident answers that nobody trusts
…you do not have a dashboard problem. You have a semantic layer problem.
In 2026, the semantic layer is getting more attention because analytics is becoming more conversational and AI-driven. When people ask questions in natural language, the system needs a single, governed meaning for “revenue”, “active customer”, “MRR”, “gross margin”, and so on. Without that, you get speed without trust. (Monte Carlo Data)
If you want an engineering team to help you design or implement a semantic layer (custom or open source, based on requirements and budget), you can reach CODO here:
https://codo.ltd/contact/
SEO meta (copy/paste)
Meta title: Semantic Layer for BI in 2026: Metrics, Governance, and AI-Ready Analytics
Meta description: A practical guide to semantic layers and metric layers in BI. Learn why they matter for trusted KPIs, self-service analytics, and AI, plus implementation patterns and common mistakes.
What is a semantic layer (simple definition)
A semantic layer is a translation layer between raw data (tables, columns, joins) and business meaning (metrics, dimensions, entities, relationships). It defines the “official” business logic so that every tool and team calculates metrics the same way. (Atlan)
Different ecosystems call it slightly different things:
- semantic layer
- metrics layer
- semantic model (Power BI)
- Looker semantic layer (LookML)
Under the hood, the goal is the same: one place where definitions live.
Why the semantic layer is trending in 2026
1) BI is becoming conversational (and AI depends on consistent meaning)
When users ask “why did churn spike last month?”, your system must know what “churn” means, which customers qualify, and which date logic applies. If definitions vary, AI will be confidently wrong. (Monte Carlo Data)
2) Self-service only scales when metrics are governed
Teams want self-service, but “everyone builds their own dataset” leads to dueling numbers. A shared semantic model is the usual fix, especially in Power BI environments. (learn.microsoft.com)
3) Companies are standardizing metrics across tools
Many teams run multiple BI tools (or multiple teams in one tool). A semantic layer is the glue that keeps definitions consistent across dashboards, exports, and embedded analytics. (Google Cloud)
Semantic layer vs metrics layer: what is the difference?
In practice, people use the terms interchangeably. But a useful mental model is:
- Metrics layer: focuses on defining metrics (KPIs), filters, and time grains, then generating consistent queries.
- Semantic layer: includes metrics, plus business entities and relationships (customer, order, product), permissions, and richer business meaning. (powermetrics.app)
Most real systems end up “hybrid”: a metrics-focused core plus semantic modeling around it.
What problems a semantic layer solves (the business outcomes)
1) “One number” for key metrics
Revenue, margin, active users, retention. Defined once, reused everywhere.
2) Faster reporting and fewer rebuilds
Instead of re-implementing the same logic in every report, you reuse the definition.
3) Safer self-service
Business users can explore without breaking logic or reinventing joins.
4) AI-readiness
If you plan to use AI assistants on top of your data, the semantic layer becomes the control point for meaning, access, and guardrails. (Google Developer forums)
Where to put the semantic layer (common architectures)
Option A: BI-tool semantic layer
Examples:
- Looker semantic layer (LookML) (Google Cloud)
- Power BI semantic models (learn.microsoft.com)
Best when:
- one BI tool is the center of gravity
- you want tight governance inside that platform
- most consumption happens in that tool
Tradeoff:
- portability across tools can be harder.
Option B: Warehouse-first semantic layer (tool-agnostic)
Examples:
- dbt Semantic Layer / MetricFlow definitions reused downstream (docs.getdbt.com)
Best when:
- multiple tools consume the same metrics
- you want definitions close to the data model
- you embed analytics into apps and services
Tradeoff:
- requires stronger data engineering discipline.
Option C: Custom semantic layer (API-first)
Best when:
- you need a single “metrics API” for products, BI, and internal tools
- you have complex permissioning, multi-tenant logic, or performance constraints
Tradeoff:
- more engineering, but maximum flexibility.
CODO often helps teams choose between these based on constraints and budget, then implements the simplest version that can scale. If you want to sanity-check your approach:
https://codo.ltd/contact/
What makes a semantic layer succeed (and what usually breaks it)
The success factors
- Metric ownership: each key metric has an owner and a definition.
- Clear grains: daily, weekly, monthly, and what “as of” means.
- Versioned definitions: changes are tracked and communicated.
- Tests: at least basic checks for metric correctness and anomalies.
- Documented business logic: not buried in one analyst’s report.
The failure patterns (very common)
- Every team defines revenue differently
- Metrics logic is copied into dashboards instead of centralized
- No “certified” models, so duplicates multiply
- Permissions are added as an afterthought
- Nobody budgets for maintenance, so it rots
Power BI governance guides often recommend “certified” models and thin reports to reduce duplicates and mismatched numbers. (bix-tech.com)
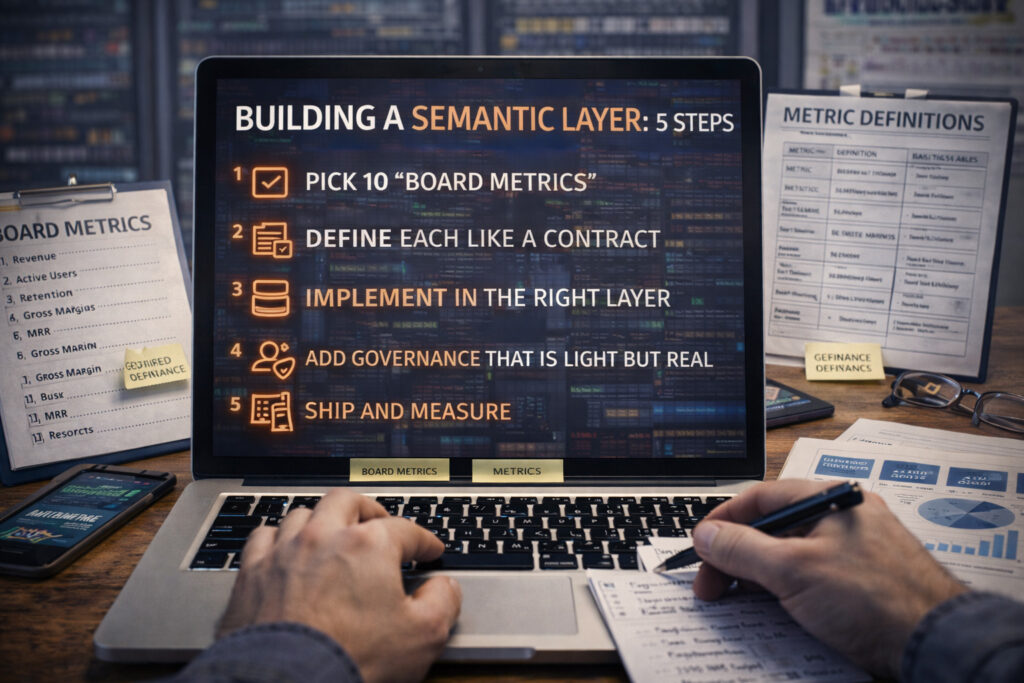
A practical implementation plan (that does not take 6 months)
Step 1: Pick 10 “board metrics”
Start with the metrics the business argues about most.
Step 2: Define each metric like a contract
For each metric:
- definition in plain language
- formula and filters
- grain (daily? monthly?)
- inclusion and exclusion rules
- source tables
- owner
Step 3: Implement in the right layer
- single BI tool? implement there first
- multiple tools? consider dbt semantic layer or a shared metrics layer (docs.getdbt.com)
Step 4: Add governance that is light but real
- “certified” vs “draft” models
- naming standards
- change process (even if simple)
Step 5: Ship and measure
Success is not “we built the layer”. Success is:
- fewer “numbers don’t match” incidents
- faster time to build new dashboards
- more adoption without chaos
If you want, CODO can help you run this as a short engineering engagement: define the first metrics, implement the layer, and wire it into your BI stack.
https://codo.ltd/contact/
FAQ
Do small companies need a semantic layer?
If you have more than a few decision-makers, and metrics start drifting, yes. Start small: 5 to 10 core metrics.
Is the semantic layer only a BI concern?
Not anymore. As AI assistants and automated reporting grow, consistent metric meaning becomes shared infrastructure. (Google Developer forums)
What is the fastest “good enough” approach?
Centralize 10 key metrics in one place (Power BI model, Looker model, or dbt semantic layer), certify it, and force new reports to reuse it.
Next step
If your teams are already feeling “dueling numbers”, the semantic layer is one of the highest ROI improvements you can make to BI. It is not flashy, but it removes a constant drag on decisions.
If you want an expert developer team to design and implement it (tailor-made or open source, based on your budget and requirements), contact CODO:
https://codo.ltd/contact/


